The Decision That Kept Changing
Raghav, a 39-year-old IT professional from Navi Mumbai, spent six months fighting with himself about whether to exit a residential investment in Kharghar or hold it. He had no pricing data, no comparable sales history, nothing. He was making a crore-level decision on instinct, and instinct kept changing depending on who he had spoken to last.
His broker said hold. His CA said the capital gains liability made selling unattractive. A colleague who had sold a similar flat six months earlier said he regretted it. None of them were wrong. But none of them were answering the actual question: was the property generating enough return to justify the capital locked in it?
The answer required separating two things Raghav had been conflating the entire time: rental yield and capital appreciation. They are not the same metric. They do not move together. And for most Indian investors, understanding the difference between them is the single biggest upgrade to how they think about property as an asset class.
Why Conflating the Two Costs Money
Most Indian property investors evaluate a purchase by asking one question: “Will this property go up in value?” That is a capital appreciation question. If the answer feels like yes, they buy. They rarely ask: “What income does this property generate while I wait for it to appreciate?” That is the rental yield question, and ignoring it means no investor knows what their property is actually costing to hold.
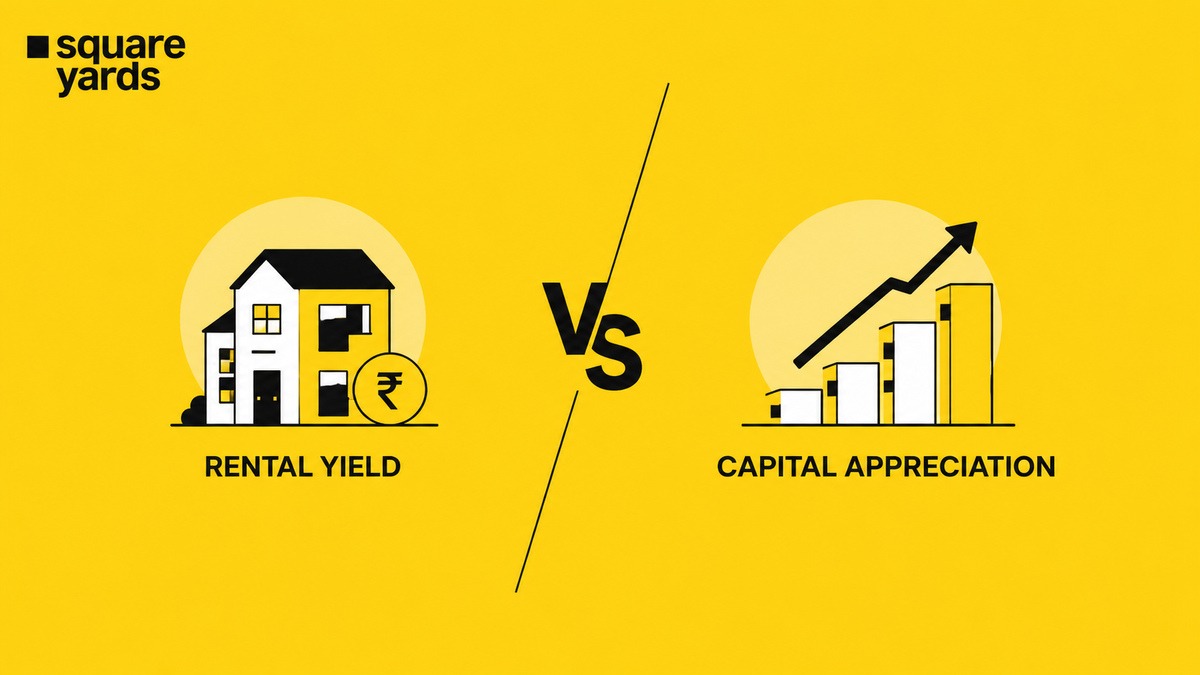
- Rental yield is the annual rental income expressed as a percentage of the property’s market value. It tells the investor the income return on deployed capital, right now. A ₹1 crore property generating ₹25,000 per month in rent has a gross rental yield of 3% (₹3 lakh annually / ₹1 crore).
- Capital appreciation is the increase in the property’s market value over time. It is unrealised until you sell. A property appreciating 10% annually is compounding wealth on paper, but generating zero liquidity unless you exit or refinance.
A 3% rental yield on a ₹1 crore property is ₹3 lakh annually, money that either funds the EMI, reduces holding cost, or compounds in another investment vehicle. Treating capital appreciation as the only metric that matters is a structural blind spot.
The New Framework: How to Think About Both Together
The Gross Yield Baseline
Start with gross rental yield:
Gross Yield = (Annual Rental Income / Property Value) x 100
In India’s major cities, gross yields typically range between 2.5% and 4.5% for residential property. Commercial and co-living assets can yield 6-9% gross, but carry different risk profiles. What you need is net yield:
Net Yield = ((Annual Rent – Annual Costs) / Property Value) x 100
Annual costs include maintenance charges, property tax, vacancy periods (budget 1-2 months annually), insurance, and property management fees. A ₹1.2 crore flat in Bangalore’s Whitefield generating ₹32,000/month looks like a 3.2% gross yield. After ₹6,000 monthly maintenance, 1.5 months vacancy, and property tax, the net yield drops to approximately 2.1-2.4%, a materially different number.
Use rental listings in Mumbai to benchmark current market rents in a target micro-market before assuming a rental income figure.
The Appreciation Reality Check
Capital appreciation data in India is notoriously anecdote-driven. Pull registered transaction data from the Square Yards property price trends section for a specific locality. Look at the price per sq ft trajectory over 36-60 months. Adjust for inflation using CPI to get real appreciation.
India’s residential market delivered strong headline appreciation in 2024 and 2025, NCR recorded a 19% year-on-year price rise in 2025. But that headline masked enormous micro-market variation. Localities anchored by new metro connectivity dramatically outperformed those dependent on speculative demand alone.
The Yield-Appreciation Trade-Off Matrix
| Market Type | Typical Gross Yield | Typical Appreciation | Best For |
| Established metro (South Mumbai, Central Delhi) | 2-2.5% | 5-8% annually | Capital growth, low income need |
| IT corridor (Whitefield, Gachibowli, Hinjewadi) | 3-4% | 8-12% annually | Balanced return seekers |
| Emerging micro-market (infrastructure trigger) | 1.5-3% initially | 12-20% in 3-5 year window | Capital appreciation play |
| Commercial (Grade A office, retail) | 6-9% | 4-6% annually | Income-first investors |
| Co-living / serviced apartment | 6-8% | 4-7% annually | Yield-maximisers |
Five Action Steps
- Calculate net yield, not gross. Subtract all holding costs. If net yield is below 2%, it is a capital appreciation play, not an income play.
- Identify which return type is actually needed. Active EMI means yield is needed to offset holding cost. Unencumbered capital means pure appreciation may serve wealth goals better.
- Benchmark against alternatives. A 2% net yield on residential property competes with fixed deposits at 6.5-7%, debt mutual funds, and REITs currently yielding 5-7% with far greater liquidity.
- Track rental yield as a leading indicator of appreciation. Rising rents in a micro-market, before prices have moved, is one of the most reliable early signals of forthcoming price appreciation.
- Re-evaluate annually. A capital appreciation play from 2020 may now be a yield play as the micro-market matures.
What Raghav Learned
Raghav eventually ran the numbers properly. Net yield was 1.9%. Capital appreciation over four years had been 14% in nominal terms, roughly 2.5% per year in real terms after inflation. Total return, including rental income, was approximately 4.5% per year in real terms.
It was not a terrible outcome. But the same capital, even in a conservative balanced mutual fund, had done better with no management burden. That realisation changed how Raghav approached every subsequent property decision.
He restructured his portfolio, shifting allocation toward micro-markets with infrastructure triggers where appreciation potential was higher, and toward a commercial unit where yield compensated for lower appreciation expectations.
How Square Yards Supports This Analysis
Square Yards’ end-to-end platform is built for exactly this kind of data-driven evaluation. The online property valuation gives a current market value estimate, the starting point for yield calculation. Investors considering new launches can explore new projects in Mumbai to access phase-wise pricing from Grade A developers, enabling total return modelling, not just the brochure promise.
Frequently Asked Questions:
1. What is rental yield in real estate investing?
The rental yield of a property is the annual income you receive through the rent you charge, expressed as a percentage of the property’s market value. A higher rental yield means that you get more rental income from your property.
2. What is the difference between rental yield and capital appreciation?
Note that rental yield is different to capital appreciation, which is the increase in the property value. Rental yield provides you with ongoing cash flow and capital appreciation provides you with long-term wealth. Profitable property investment is all about optimising both.
3. Is rental yield or capital appreciation more important for property investment?
If you are looking for income, then you should focus on rental yields and if you are expecting appreciation in the value of property then you should look at capital appreciation.
4. How do you calculate rental yield on a property?
Rental Yield = net rent / market value * 100 .For example: If market value is ₹1 crore and the annual net rent is ₹3 lakh; then Gross Rental Yield is 3% (This figure is an example and you should consider maintenance costs and vacancies to get a Net Rental Yield).
5. What factors influence capital appreciation in real estate?
Capital appreciation is a function of many factors such as local infrastructure, city and region growth story, employment growth, connectivity to major cities, upcoming projects in the vicinity, current and future supply-demand dynamics of the market etc. A property in an up and coming market with good economic fundamentals and infrastructure drivers stands to gain better returns as compared to a property in an over-supplied and mature micro-market.
